arviz_plots.plot_energy#
- arviz_plots.plot_energy(dt, *, sample_dims=None, kind=None, show_bfmi=True, threshold=0.3, plot_collection=None, backend=None, labeller=None, aes_by_visuals=None, visuals=None, stats=None, **pc_kwargs)[source]#
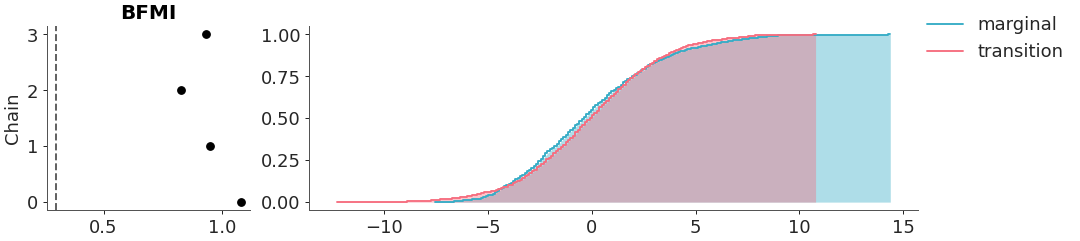
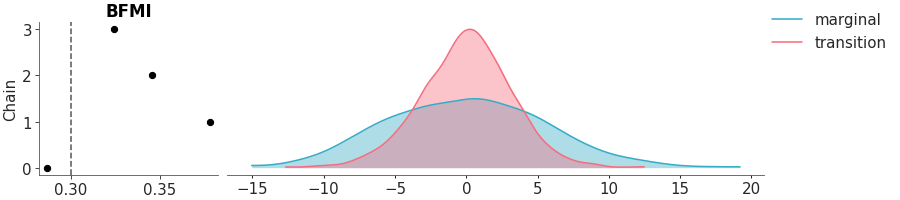
Plot energy distributions and bfmi from gradient-based algorithms.
Generate a figure with the marginal energy distribution and the energy transition distribution. Optionally, include a BFMI panel to inspect chain-wise Bayesian Fraction of Missing Information values. Values below the threshold indicate poor exploration of the energy distribution.
For details on BFMI and energy diagnostics see [1] for a more practical overview check the EABM chapter on MCMC diagnostic of gradient-based algorithms.
- Parameters:
- dt
xarray.DataTree sample_statsgroup with anenergyvariable is mandatory.- sample_dimssequence of
str, optional Dimensions to consider as sample dimensions when computing BFMI. Defaults to
rcParams["data.sample_dims"]- kind{“kde”, “hist”, “dot”, “ecdf”}, optional
How to represent the marginal density. Defaults to
rcParams["plot.density_kind"]- show_bfmibool, default
True Whether to include the BFMI scatter plot. If
False, only the energy plot will be shown.- threshold
float, default 0.3 Reference threshold for BFMI values, values below this indicate poor exploration of the energy distribution.
- plot_collection
PlotCollection, optional - backend{“matplotlib”, “bokeh”, “plotly”}, optional
- labeller
labeller, optional - aes_by_visualsmapping of {
strsequence ofstr}, optional Mapping of visuals to aesthetics that should use their mapping in
plot_collectionwhen plotted. Valid keys are the same as forvisuals.- visualsmapping of {
strmapping or bool}, optional Valid keys are:
dist -> depending on the value of kind passed to:
“kde” -> passed to
line_xy“ecdf” -> passed to
ecdf_line“hist” -> passed to
step_hist“dot” -> passed to
scatter_xy
title -> passed to
labelled_titlelegend -> passed to
arviz_plots.PlotCollection.add_legendremove_axis -> not passed anywhere, can only be
Falseto skip calling this functiontitle -> passed to
labelled_titlebfmi_points -> passed to
scatter_xyfor BFMI scatter plotylabel -> passed to
labelled_yfor BFMI column y-axis labelface -> visual that fills the area under the energy distributions.
Defaults to True. Depending on the value of kind it is passed to:
“kde” or “ecdf” -> passed to
fill_between_y“hist” -> passed to
histdot -> ignored
- statsmapping, optional
Valid keys are:
dist -> passed to kde, ecdf, …
- **pc_kwargs
Passed to
arviz_plots.PlotCollection.wrap
- dt
- Returns:
References
[1]Betancourt. Diagnosing Suboptimal Cotangent Disintegrations in Hamiltonian Monte Carlo. (2016) https://arxiv.org/abs/1604.00695
Examples
Plot an energy plot using ecdf for the energy distributions.
>>> from arviz_plots import plot_energy, style
>>> style.use("arviz-variat")
>>> from arviz_base import load_arviz_data
>>> data = load_arviz_data('non_centered_eight')
>>> plot_energy(data, kind="ecdf")